


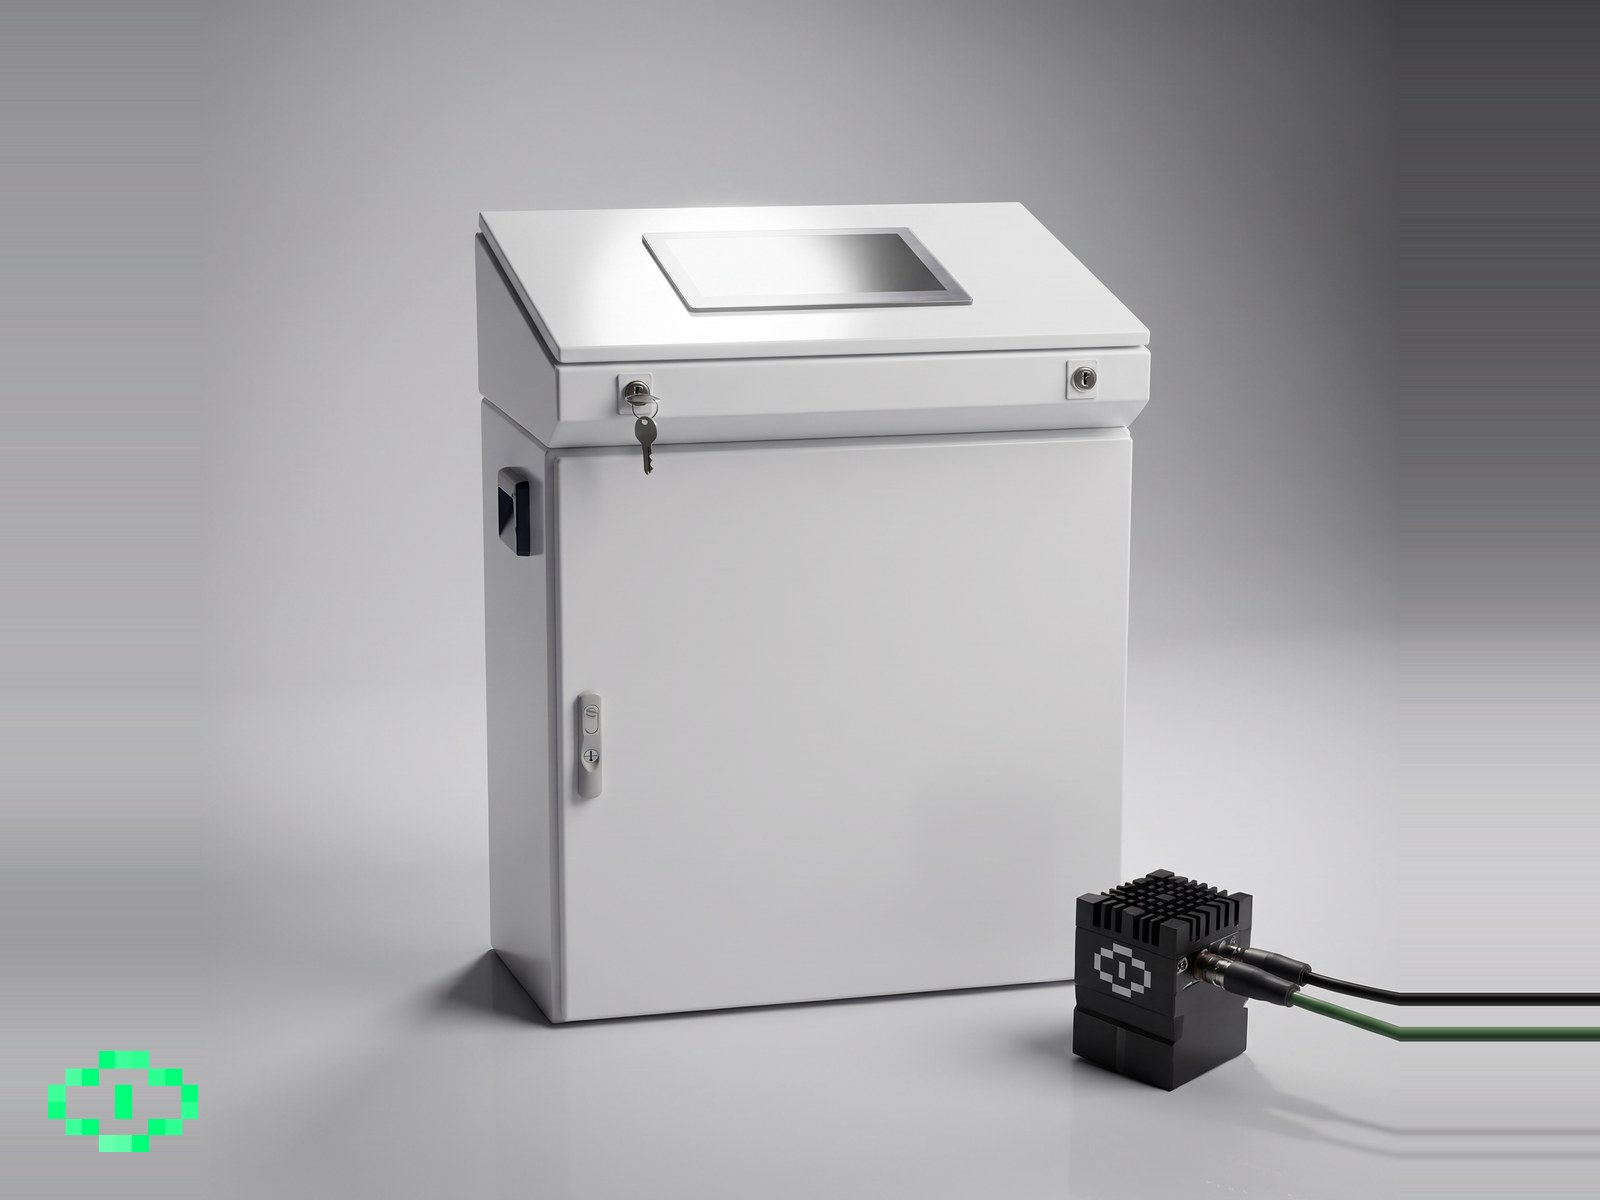
DV100
The full inspection station
The standard system. One camera over the line and a control box doing the inference, sized for continuous production.
- 1× industrial camera unit
- 1× control box
Join us in building autonomous factories — starting with inline AI vision inspection for plastics, metal and packaging.
Backed by leading programs – trusted by the companies we serve.






How it Works
Easy to deploy proprietary AI-models specifically for manufacturing.
Mount the camera and capture as little as 100 images directly from your production line. Deepvis learns from real-world variation — including lighting, shape, and recycled material inconsistencies.
Annotate just 120 examples — or let us assist. The model learns the defect types you annotate, and sharpens as more production images come in.
Click “Train Model” and let the system process your images. In around 2 hours, your custom model is ready to run live and sort out defective parts automatically.
Our products
The same models, dashboard and machine I/O. The difference is how much hardware the line has room for.
The full inspection station
The standard system. One camera over the line and a control box doing the inference, sized for continuous production.
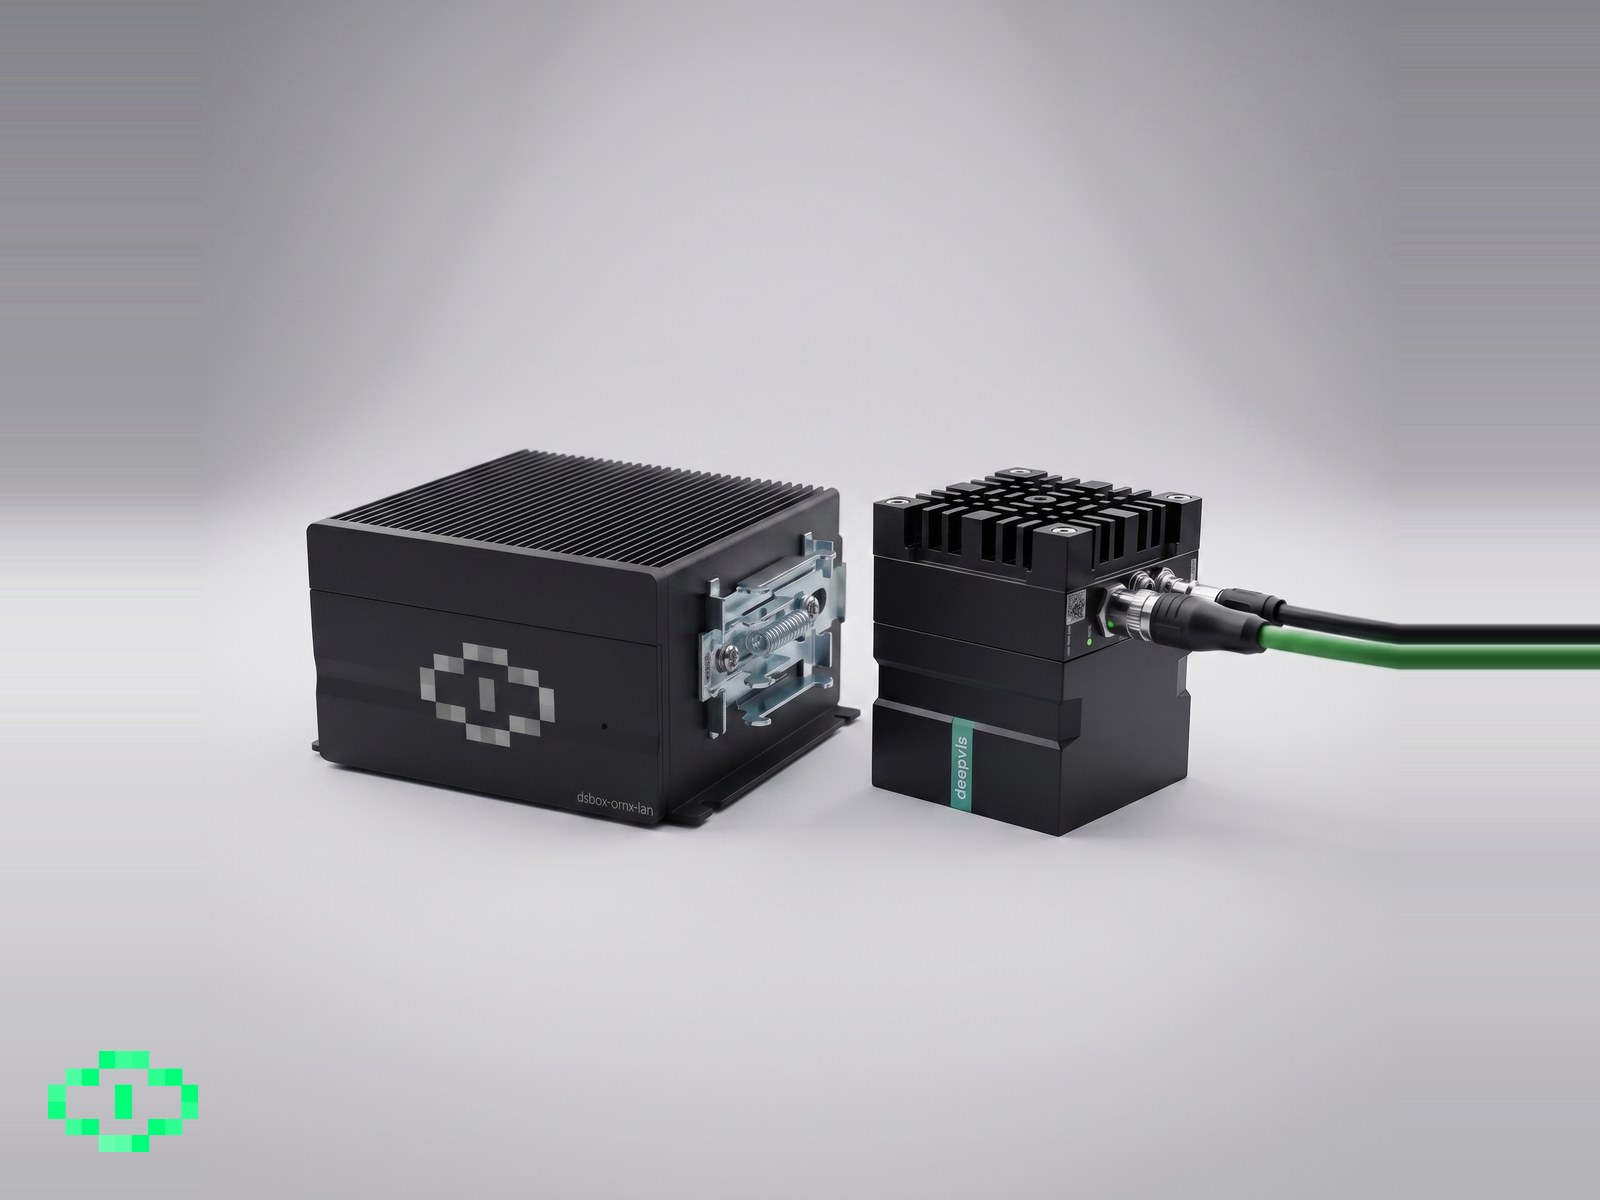
Compact, for tighter installs
The same inspection in a smaller footprint, running on a Jetson Orin NX. Thin enough to mount on DIN rail inside a cabinet you already have, for machines where there is no room for a full enclosure.
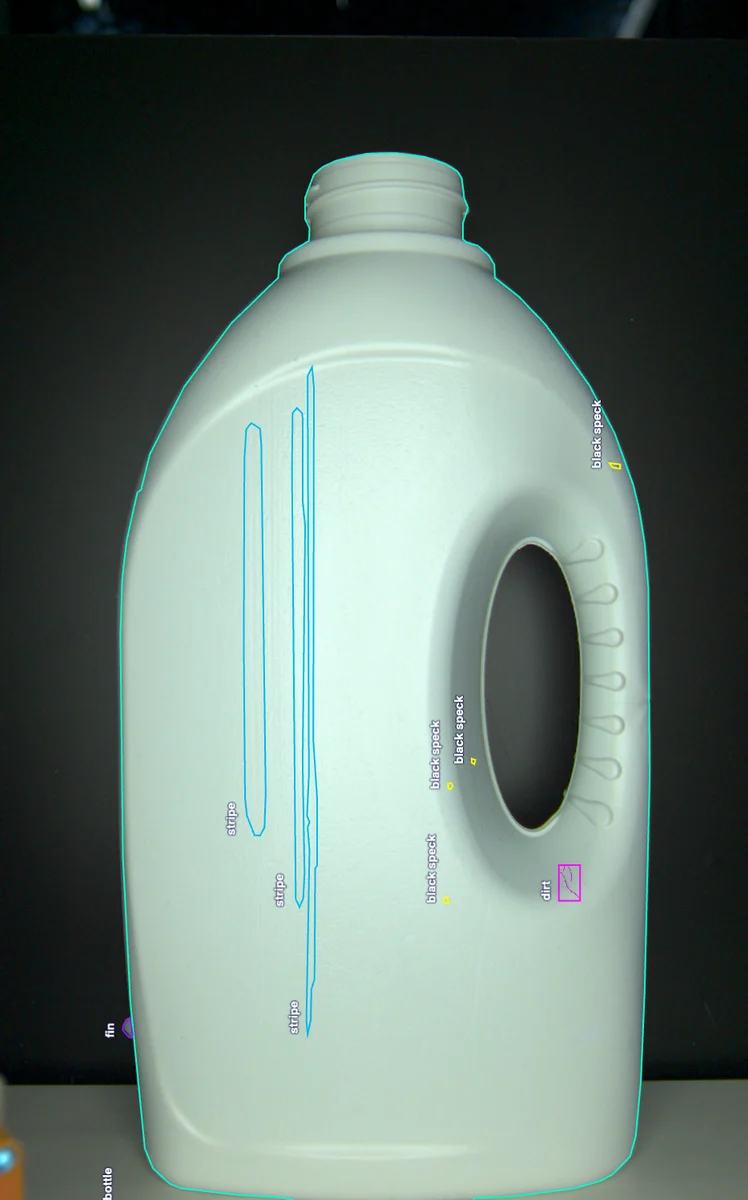
The defects that matter on a moulding line, on real parts
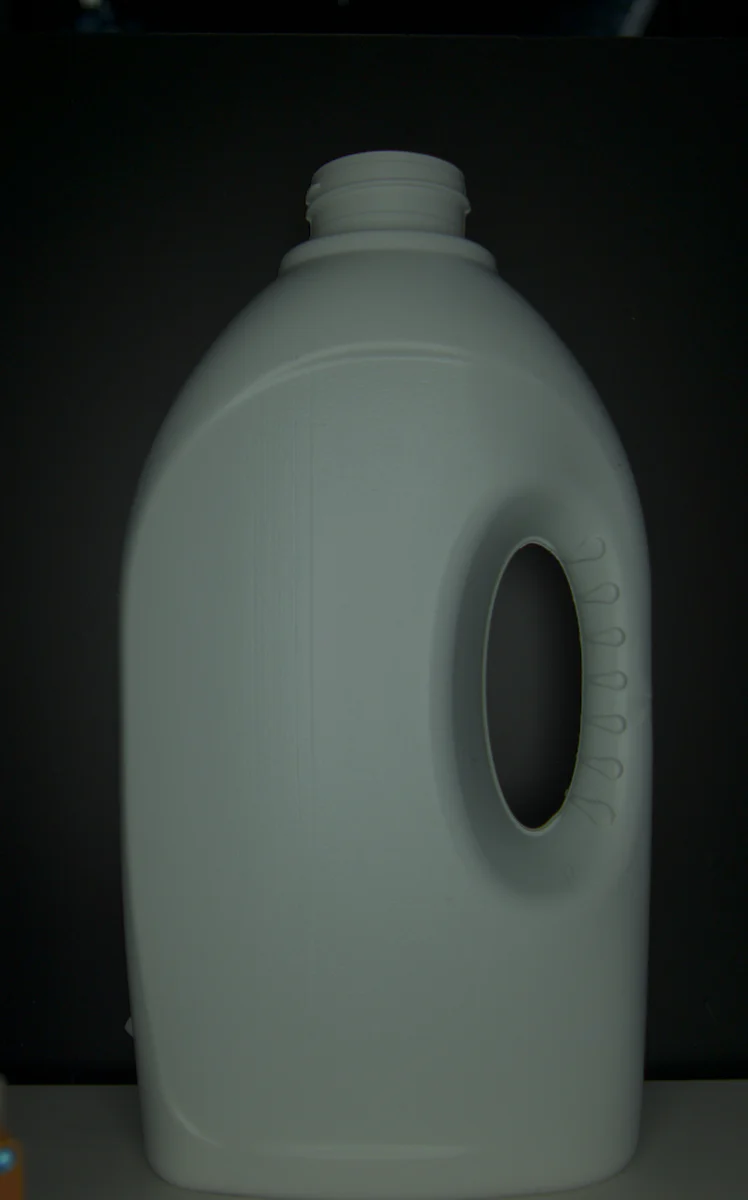
One frame, many questions answered at once. The model segments the bottle itself, then every stripe, black speck and patch of dirt on it — each as an outline rather than a box. An outline can be measured, so the same pass that finds a defect also classifies it, sizes it in mm², and decides whether it crosses the threshold that fires the reject.
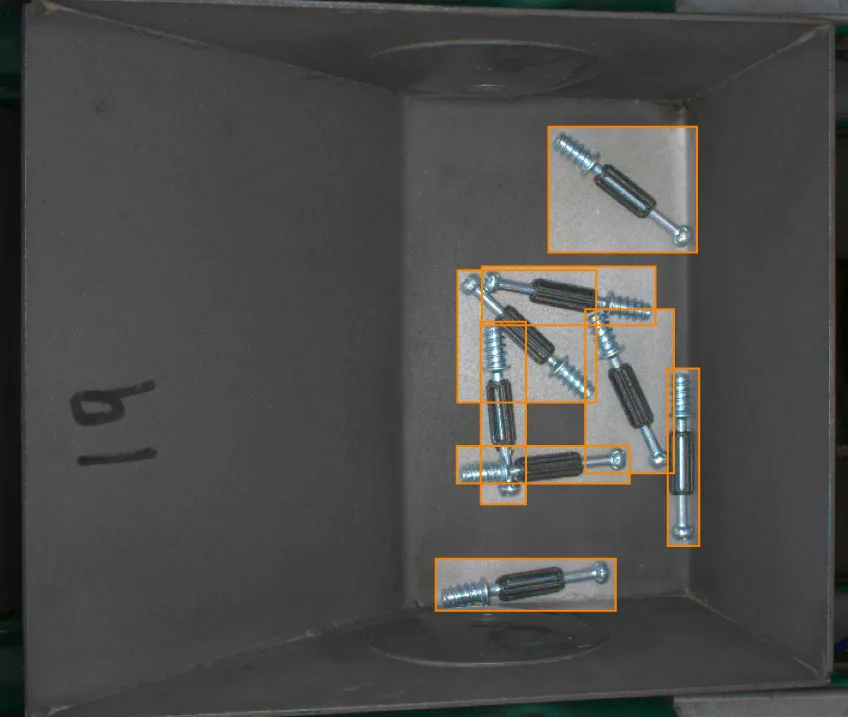
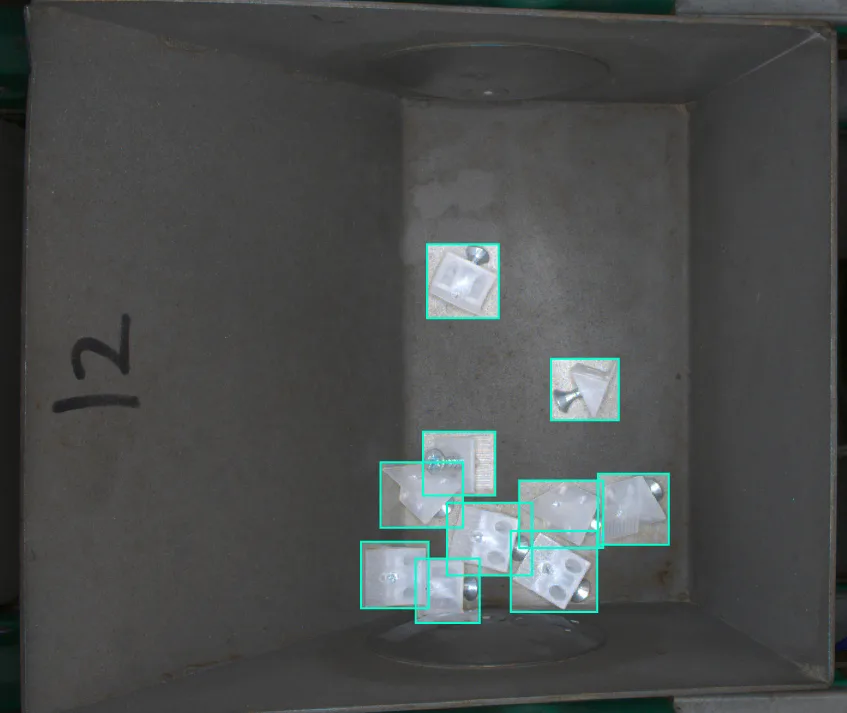
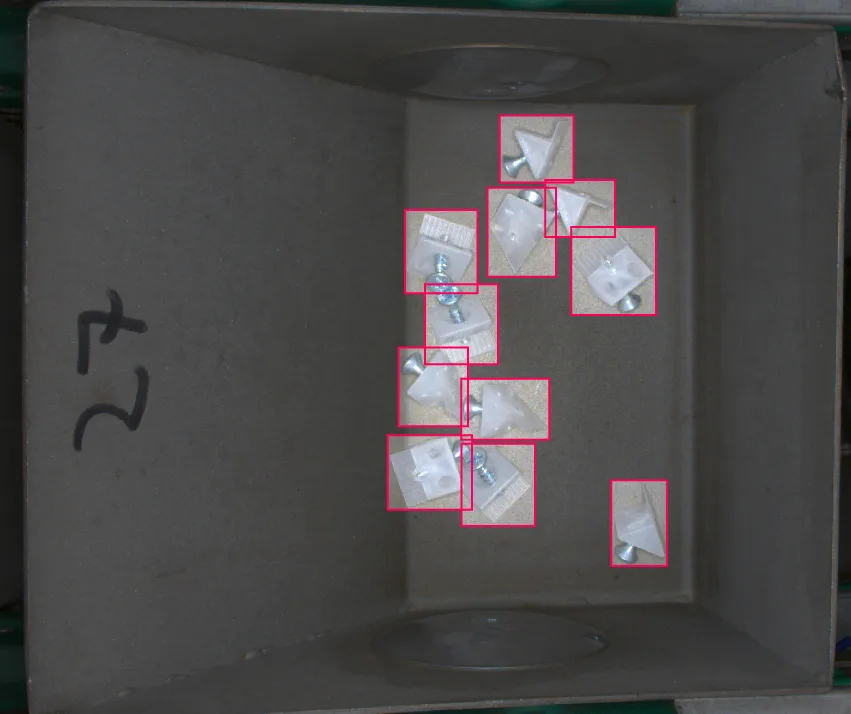
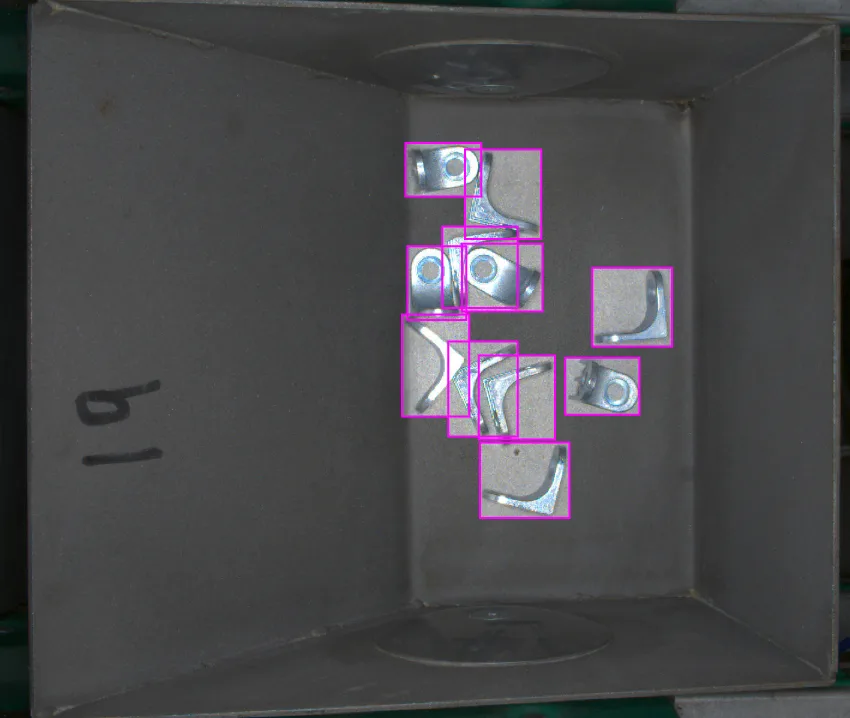
What the operator sees at the machine, right now. Detections are drawn on the stream as parts pass, with the cavity and confidence attached.
How the line acts on it →Go back to any run and see what was produced and what the system caught — part, batch, counts and reject rate.
Everything that gets recorded →| Run | Part | Batch | Started | Parts | NOK | Rate | |
|---|---|---|---|---|---|---|---|
| R-4821 | Cap 32mm | B-2291 | 08.03 07:02 | 18,420 | 61 | 0.33% | Completed |
| R-4820 | Lid 88mm | B-2288 | 07.03 23:04 | 21,150 | 44 | 0.21% | Completed |
| R-4819 | Cap 32mm | B-2287 | 07.03 15:01 | 19,880 | 96 | 0.48% | Flagged |
| R-4818 | Housing A | B-2284 | 07.03 07:03 | 16,240 | 38 | 0.23% | Completed |
Deepvis helps you visualize and track defect trends, product performance, and production issues — all in real time. With actionable insights, you can optimize processes and reduce waste without slowing down your line.
Correlate
Cavity 4 makes 2.5× the overmould
vs the other cavities · 24 h
Correlation and causation
Every defect is classified, measured and filed into a category — so the data is comparable rather than anecdotal.
Once defects carry a class, a size and a place in the process, patterns surface on their own: which cavity, which shift, which material batch. That is the difference between knowing your reject rate and knowing what is causing it.
See the full statistics feature set →Discover how AI-driven visual inspection can reduce errors, cut costs, and adapt to your production line — without complex setups.